描述
Create and display a Data Chart on your site within a few click. Easily visualize your data!
This plugin supports 8 chart types: bar, line, area, pie, bubble, radar, polar, and scatter.
How To Use?
- Go to -> B-Chart from Dashboard menu -> Add New.
- Configure the Chart according to your preference
- Copy the Generated shortcode from the chart edit screen and paste in shortcode block in the edit screen of a post or page.
- Enjoy !!!
⭐ Checkout our other WordPress Plugins-
🔥 Html5 Audio Player – Best audio player plugin for WordPress.
🔥 Html5 Video Player – Best video player plugin for WordPress.
🔥 PDF Poster – A fully-featured PDF Viewer Plugin for WordPress.
🔥 StreamCast – A fully-featured Radio Player Plugin for WordPress.
🔥 3D Viewer – Display interactive 3D models on the webs.
螢幕截圖
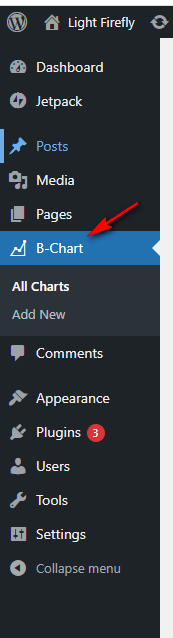
Sidebar menu 
Chart List 
Create Chart 
Pie Chart 
Line Chart 
Bar Chart 
PolarArea Chart 
Radar Chart 
Doughnut Chart
Blocks
This plugin provides 1 block.
- B Chart - The Chart Plugin for WordPress
安裝
This section describes how to install the plugin and get it working.
e.g.
- Upload
plugin-directoryto the/wp-content/plugins/directory - Activate the plugin through the ‘Plugins’ menu in WordPress
- Use shortcode in page, post or in widgets.
- If you want player in your theme php, Place
<?php echo do_shortcode('YOUR_SHORTCODE'); ?>in your templates
評價
2021年11月16日
Paid for the pro version only for the OneDrive capability. No documentation included with the plugin, no instructions on what the Redirect URI is for the plugin so pretty much worthless to me at the moment. No replies from any of the "support" email contacts and gmail contact gets generic response that the user is "On Vacation". Quite frustrated.
2021年11月5日
1 reply
im japanese.
I have tried many plug lines and this is the easiest to use if it is free.
It also supports animation and provides a rich display without any hassle.
However, it is very disappointing that it does not display a simple pie chart.
You have to use a donut graph instead. Also, you cannot change the color of the donut graph as you wish.
However, I have not found a plug-in that is easier to use for data visualization than this one, and I will continue to use it.
2021年11月5日
This plugin support multiple data set and color which enabled me to represent data properly.
Best plugin for data visualization
貢獻者及開發者
修改日誌
1.0.1
- Added Pie Chart Option
- Improved Settings Panel
- More organized Options
- Added new Screenshots
- Fix mirror issues
1.0.0
- Initial Release